How to read a steel hollow section EPD
- Share
- Issue Time
- Nov 16,2026
Summary
An EPD is easy to misread. This guide covers the three things to check first - the verification block, the declared unit and the module table - then how to convert a per-kilogram figure to a per-metre one, which indicators EN 15804 requires, what module D does and does not mean, and the four points that are easy to overlook when applying a declaration to a live project.
An EPD can run to many pages and it reads like a financial statement. If you have not met the format before, a wall of abbreviations and units that mean nothing at first glance is enough to make you close the file and come back to it later. So here is what to look at, and the order worth reading it in. Start with three things: the verification block, the declared unit, the module table. In that order. The indicator table will not tell you much until you know what unit it is counting and which part of the life cycle it covers. An EPD is a standardised statement of environmental information built on a life cycle assessment. It is published under a programme and checked against that programme's rules, which is the part that separates it from a manufacturer writing its own numbers. Most of the ones you will see call themselves Type III environmental declarations under ISO 14025. The editions differ, so check which one a document cites instead of assuming they were all built to the same rulebook. For construction products the core rules come from EN 15804, which is used across Europe and by a number of programmes elsewhere. It settles two questions: which life cycle modules a declaration must or may cover, and which environmental indicators have to be reported. Check the exact revision a document cites, EN 15804:2012+A2:2019/AC:2021 for instance, instead of assuming that anything recent follows the same rules and the same methods. EN 15804 sets the method. A PCR, or Product Category Rules, sets the detail for one product group. Two EPDs for the same kind of product can rest on different PCRs if they were registered under different programmes, and that on its own is enough to move their numbers apart. So the PCR, and which version of it, decides before anything else whether two declarations can be compared at all. No two declarations are laid out the same way, but the same six pieces of information tend to be in there somewhere. Find them before you read anything else. Look for the verification statement, the name of the verifier or certification body and the fact that it is approved under the programme, and the route the programme requires. Then check that the declaration is on the operator's public register and still current. If it is not there, the document is worth questioning no matter how convincing it looks. ISO 14025:2006 allowed verification by an independent internal body as well as by an external third party, in certain contexts. Internal independent verification is not the same as an unverified self-declaration, and the two should not be lumped together. For construction-product EPDs, though, the programmes that run EN 15804 require an independent third party, and the verifier has to be approved or accredited under that programme. So check the edition cited, the rules of the programme the declaration was registered under, and the verification route the document states. What you are really testing is independence. The verifier should not have helped compile the assessment and should have nothing to gain from how it comes out. The operator's own rules, its approval of verifiers and the current registration status count for as much as that independence does. Every EPD names the unit its results refer to: a declared unit, or a functional unit where the rules allow one. For steel hollow sections it is normally a declared unit given as a mass, 1 kg or 1 tonne. That single line decides whether two declarations can be put side by side at all. With hollow sections there is a second step, because nobody buys by the kilogram. To reach a per-metre figure, multiply by the mass of the section, which moves with size, wall thickness and the section standard you are working to. A plain example: an EPD reporting an A1–A3 GWP-total of 2.0 kg CO2e per kg, and a cold-formed 100×100×5 mm SHS with a tabulated mass of about 14.4 kg/m. Together they come to 28.8 kg CO2e per metre, over A1–A3. Take the mass from the product data or from the section standard, and make sure the EPD covers the product you are actually specifying. The multiplication is arithmetic. It adds nothing to the accuracy of the original figure, and it does not change which indicator or which modules that figure covered. The same section needs a word on functional units. A declared unit is a quantity of product. A functional unit ties the results to a measure of performance, under stated conditions, often over a stated period. Before you set two declarations against each other, read the performance and service-life assumptions behind that functional unit. EN 15804 cuts a product's life into information modules. Which of them a declaration covers is where comparisons most often go wrong. Under EN 15804+A2 the minimum scope usually runs to A1–A3, C1–C4 and module D, unless the product meets the specific conditions for leaving out the end-of-life and beyond-boundary modules. A1–A3 on its own is allowed only where those conditions are met, and no product should be assumed to qualify. Check the basis in the declaration itself. A4 answers a different question. A declaration can cover the production and end-of-life modules it is required to cover and still say nothing about delivery to site. So an EPD carrying A1–A3, C1–C4 and D is not one that stops at the factory gate. Read the modules one at a time instead of summing the coverage up in a phrase. A1–A3 does include transport, in A2, but that is transport of raw material to the works. Delivery of the finished section to site sits in A4, and it is often left undeclared. Put an A1–A3 figure next to an A1–A4 figure and you are comparing two different boundaries. Some of the gap will be the delivery, not a difference in how the steel was made. Line the modules up before you line the numbers up. Two hollow section EPDs can cover the same product, in the same unit, over the same modules, and still sit a long way apart. The steelmaking route and the background data are two of the main reasons. They are not the only ones. First, the route the steel came by. Iron ore through a blast furnace and scrap through an electric arc furnace are not the same process, and they do not start from the same metallic input. What comes out also depends on the energy supply and on how the plant is run. Neither route is wrong. They draw on different resources. The route is usually in the product description or the methodology section, so look there rather than reading it off the headline number. Second, the background data. An LCA takes the plant's own figures and combines them with secondary datasets for what sits behind it: electricity supply, transport, alloying elements. Those datasets have versions and years. The same plant, untouched, can come out noticeably different on a 2019 grid factor and on a 2023 one. Which is why a methodology section that names its software and its database is worth reading. The software, the database version and the reference years tell you whether a gap might come from data and modelling rather than from production. On their own they will not tell you the cause. There is a third thing to check, and it is easy to miss: what the declaration actually represents. One plant, several plants, a product range, an industry average. An industry-average EPD is not a measurement of the plant that will supply you, and a multi-plant EPD is not a measurement of one site. Processing, energy supply and modelling assumptions differ between declarations for the same grade. GWP is the number most people go to first, and it usually sits at the top of the results table. EN 15804 asks for a set of indicators, though, and the others are not there to fill space. On some projects acidification and water carry as much weight as carbon. The table below covers the core environmental impact indicators that EN 15804+A2 requires. It is not everything an EPD reports. The standard also lists additional impact indicators (particulate matter, ionising radiation, human toxicity, freshwater ecotoxicity, soil quality), and resource use, waste and output flows get tables of their own. Two details worth catching. GWP comes as four rows in the current revision: a total, plus three sources, fossil, biogenic and land-use change. GWP-total is those three added up. It is not a fourth source. A single GWP row can mean an older framework, but confirm the revision in the document rather than guessing from the summary table. And module D is reported apart from the rest: potential net benefits and loads beyond the system boundary, from reuse, recycling and energy recovery. It is not always negative, and a negative D should not simply be taken off A1–A3 to make the product stage look smaller. Four things tend to get missed when a declaration is put to work on a live project. A4, where it is declared, rests on a transport scenario written into the EPD. Your route may be nothing like it. Check the distance, the mode and the other assumptions before the figure goes into a project. A5 can carry installation waste, worked out from a wastage scenario the declaration states. If A5 is missing, or the scenario does not fit the job, the cut-offs and offcuts have to be handled separately at project level. An EPD is not a warranty on how long the product lasts. It may give a reference service life under stated conditions, or it may say nothing about service life at all. Where one is given, read what it assumes. EPDs from different programmes, or built on different PCRs, are not necessarily comparable. Before you rank one supplier against another, check that the rules, methods and scenarios underneath are compatible. For a live project, this is a workable first pass. A hard comparison will need more than one. The document will not be laid out in this order, so read it in this one anyway. Our own declaration reads the same way. The Yuantai Derun steel hollow section EPD is issued to EN 15804 and ISO 14025 under Global GreenTag International Standard v4.1, declared unit one kilogram. The figure we publish is a GWP-total of 1.95 to 2.21 kg CO2e per kilogram over A1 to A3, which is the range given in the declaration. Which modules the full report covers is set out there. If a project needs C1 to C4, module D or anything else, ask and we will go to the report and confirm. We would rather do that than quote a number we have not seen. The declaration and our entry on the operator's public register can both be checked without asking us, and the file downloads from the certifier's own site. Links to all of it are on our EPD certification page. If you are working through another supplier's declaration and want a second pair of eyes on the boundary, send it across. We read these most weeks. Writing a specification that calls for an EPD? Send us the clause, and the sizes you are working with.
How to read a steel hollow section EPD
What an EPD actually is
Six things to find in any EPD
Section What it tells you When to read it General information Owner, programme operator, declaration number, issue date, validity, PCR reference First Product description What exactly is covered: profiles, grades, dimensions, and which plant or plants Second Methodology Declared unit, system boundary, data sources, allocation rules Third Scenarios Assumptions behind any declared transport, installation, use, maintenance, replacement or end-of-life module If declared Results The indicator table, often dense and set across several pages Fourth Verification The verification statement, who verified it and against what, and the registration Always 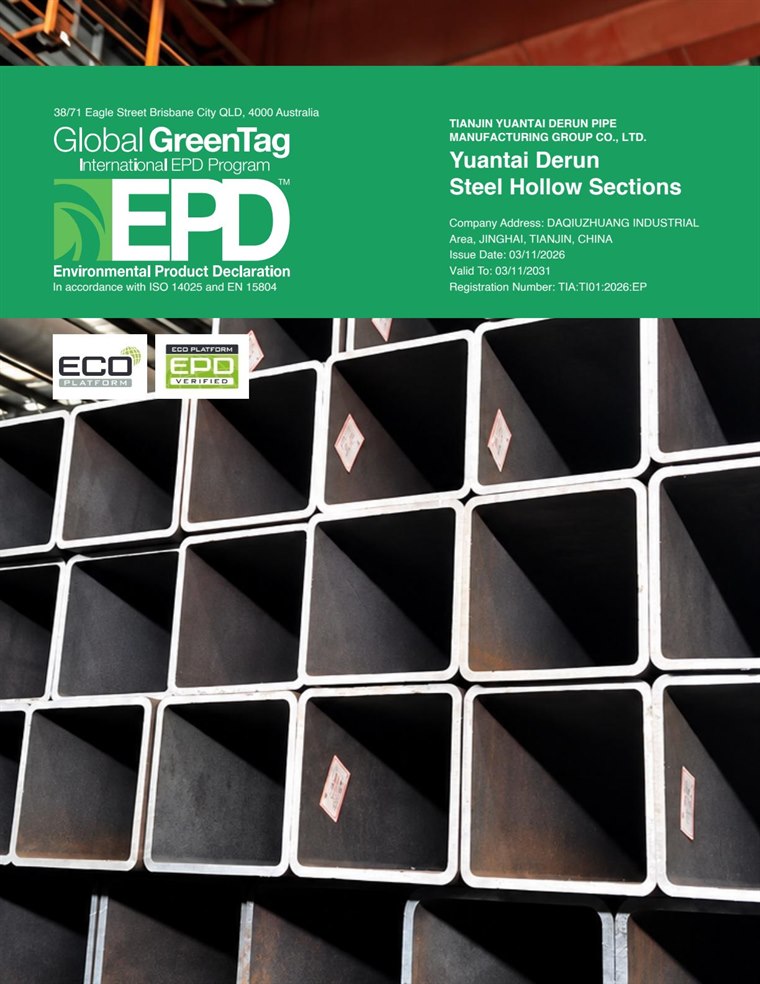
The verification block
The declared unit: the line people skim past
The module table shows the boundary
Module Stage Covers A1 Product Raw material supply A2 Product Transport of raw materials to the manufacturer A3 Product Manufacturing A4 Construction Transport to the building site A5 Construction Installation B1–B5 Use Use, maintenance, repair, replacement, refurbishment B6–B7 Use Operational energy and water C1–C4 End of life Deconstruction, transport, waste processing, disposal D Beyond the boundary Potential net benefits and loads from reuse, recycling and energy recovery, reported separately 
Why steel figures vary so much between suppliers
The indicator table: GWP is not the whole table
Indicator Measures Unit GWP-total Global warming potential, all sources combined. The sum of the three rows below kg CO2 eq. GWP-fossil Climate-change contribution associated with fossil sources kg CO2 eq. GWP-biogenic Climate-change contribution from biogenic carbon emissions and removals kg CO2 eq. GWP-luluc Climate-change contribution from land use and land use change kg CO2 eq. ODP Ozone depletion potential kg CFC 11 eq. AP Acidification potential mol H+ eq. EP-freshwater Eutrophication, freshwater kg P eq. EP-marine Eutrophication, marine kg N eq. EP-terrestrial Eutrophication, terrestrial mol N eq. POCP Photochemical ozone creation potential kg NMVOC eq. ADPE Abiotic depletion, minerals and metals. Also labelled ADP-minerals&metals kg Sb eq. ADPF Abiotic depletion, fossil fuels. Also labelled ADP-fossil MJ WDP Water scarcity-weighted deprivation, not the physical volume of water used m³ world eq. deprived What an EPD does not tell you automatically
The order to read it in
Where our own declaration sits